Dashboard – Virtual Machine Overview
The Dashboard window for an individual virtual machine offers a focused view of that VM’s usage, performance trends, and associated snapshots and templates.
📸 Screenshot:
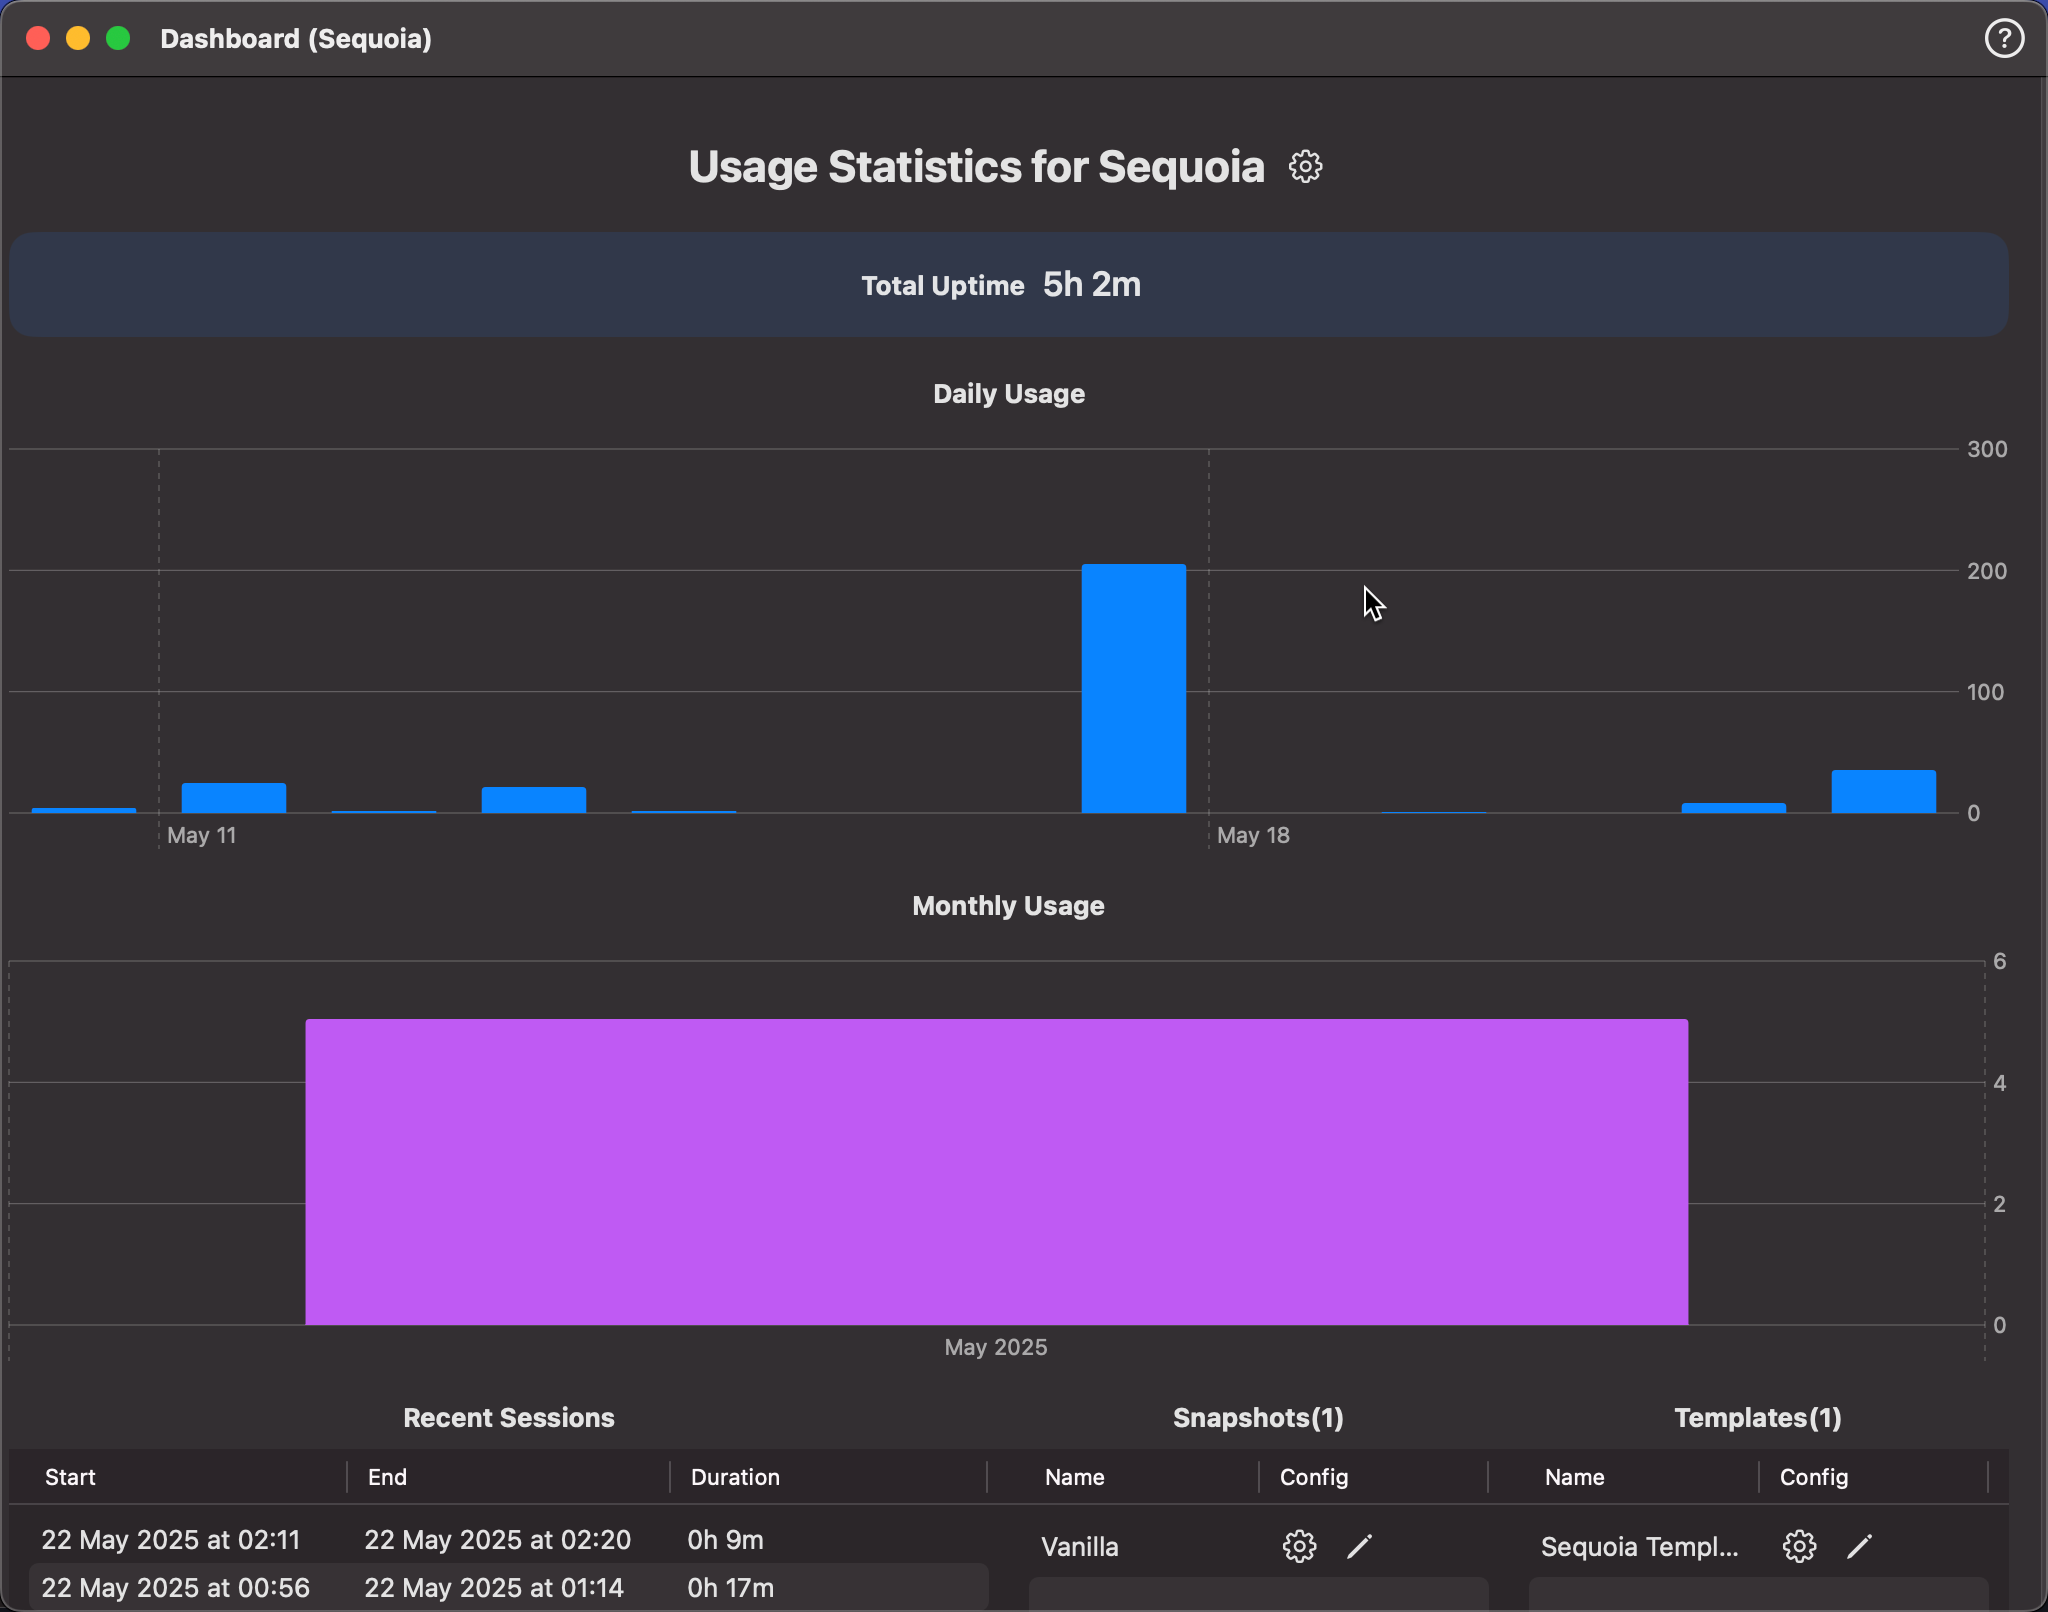
This dashboard helps you monitor the lifecycle and interaction history of each virtual machine in detail.
⏱ Total Uptime
A clear indicator at the top shows the cumulative time this VM has been actively used.
📅 Daily Usage
The bar chart provides an overview of how many minutes this VM was active per day over the recent period. This helps in identifying usage trends over time.
📆 Monthly Usage
This chart summarizes the virtual machine's total uptime for each month—ideal for high-level reporting and resource planning.
🕘 Recent Sessions
Below the charts, the Recent Sessions table displays:
- Start and End Timestamps
- Duration of each session
This helps track active usage and validate operational periods.
🧱 Snapshots
All snapshots taken for this VM are shown here.
- ⚙️ Config: View the full configuration associated with the snapshot.
- ✏️ Edit: Edit the snapshot name or notes.
🧩 Templates
Templates created from this VM.
💡 This per-VM dashboard provides powerful insight into how your virtual environments are used, helping optimize development, testing, or production workflows.