Dashboard – All Virtual Machines
The Dashboard All window provides a unified overview of your virtual machine activity and resources across the entire VirtualProg environment.
📸 Screenshot:
This dashboard enables easy monitoring and quick access to your virtual machines, snapshots, and templates.
🔝 Top Toolbar
From left to right:

-
📤 Export
Export the dashboard data to a CSV file for external analysis. -
📸 Screenshot
Screenshot the dashboard as png. -
❓ Help
Dashboard Help
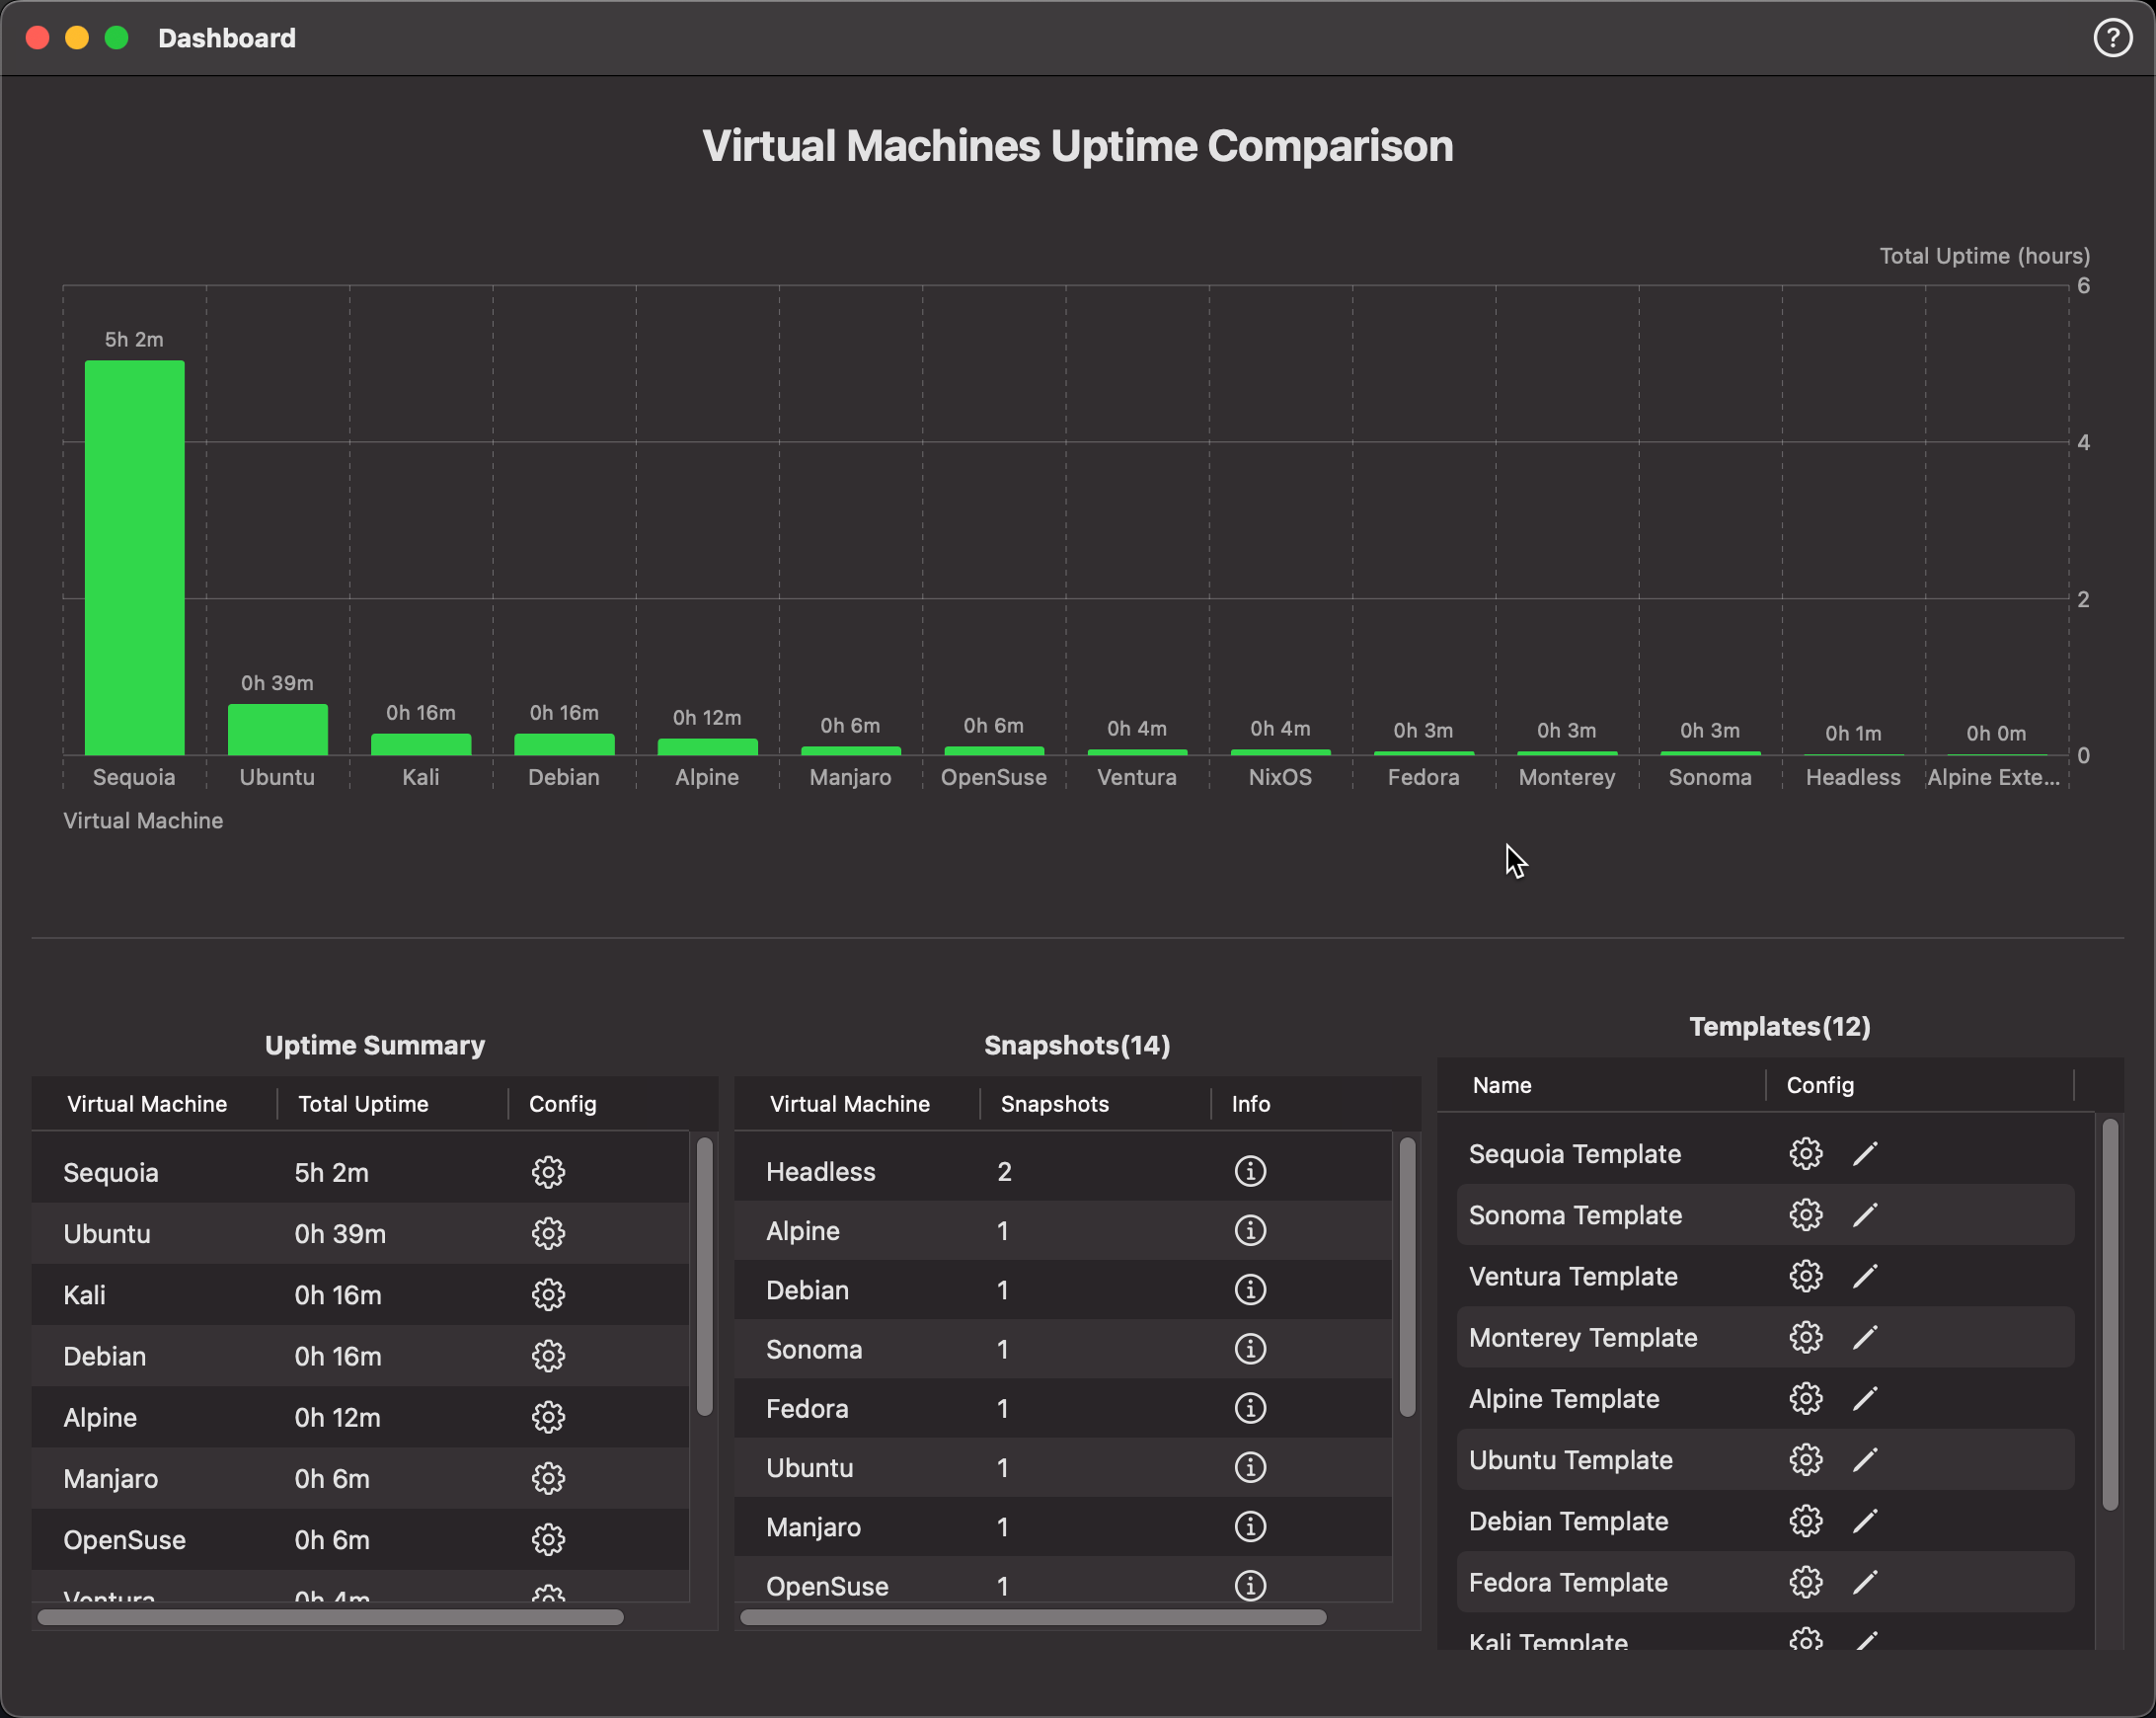
📊 Uptime Comparison Chart
At the top, a bar chart visualizes the total uptime for each virtual machine. This gives a quick sense of which VMs are most actively used.
- Clicking a bar opens the individual VM dashboard for that virtual machine.
📋 Uptime Summary
The table below the chart lists:
- Virtual Machine Name
- Total Uptime
- ⚙️ Config: Click the gear icon to open the VM’s configuration.
🧱 Snapshots Panel
Shows the total number of snapshots associated with each virtual machine.
- ℹ️ Info Button: Opens the Snapshots window for the selected VM.
🧩 Templates Panel
Displays all available templates.
💡 This dashboard consolidates everything in one place—making it easier to track uptime, monitor snapshot usage, and manage VM templates effectively.