Linked Clone Topology
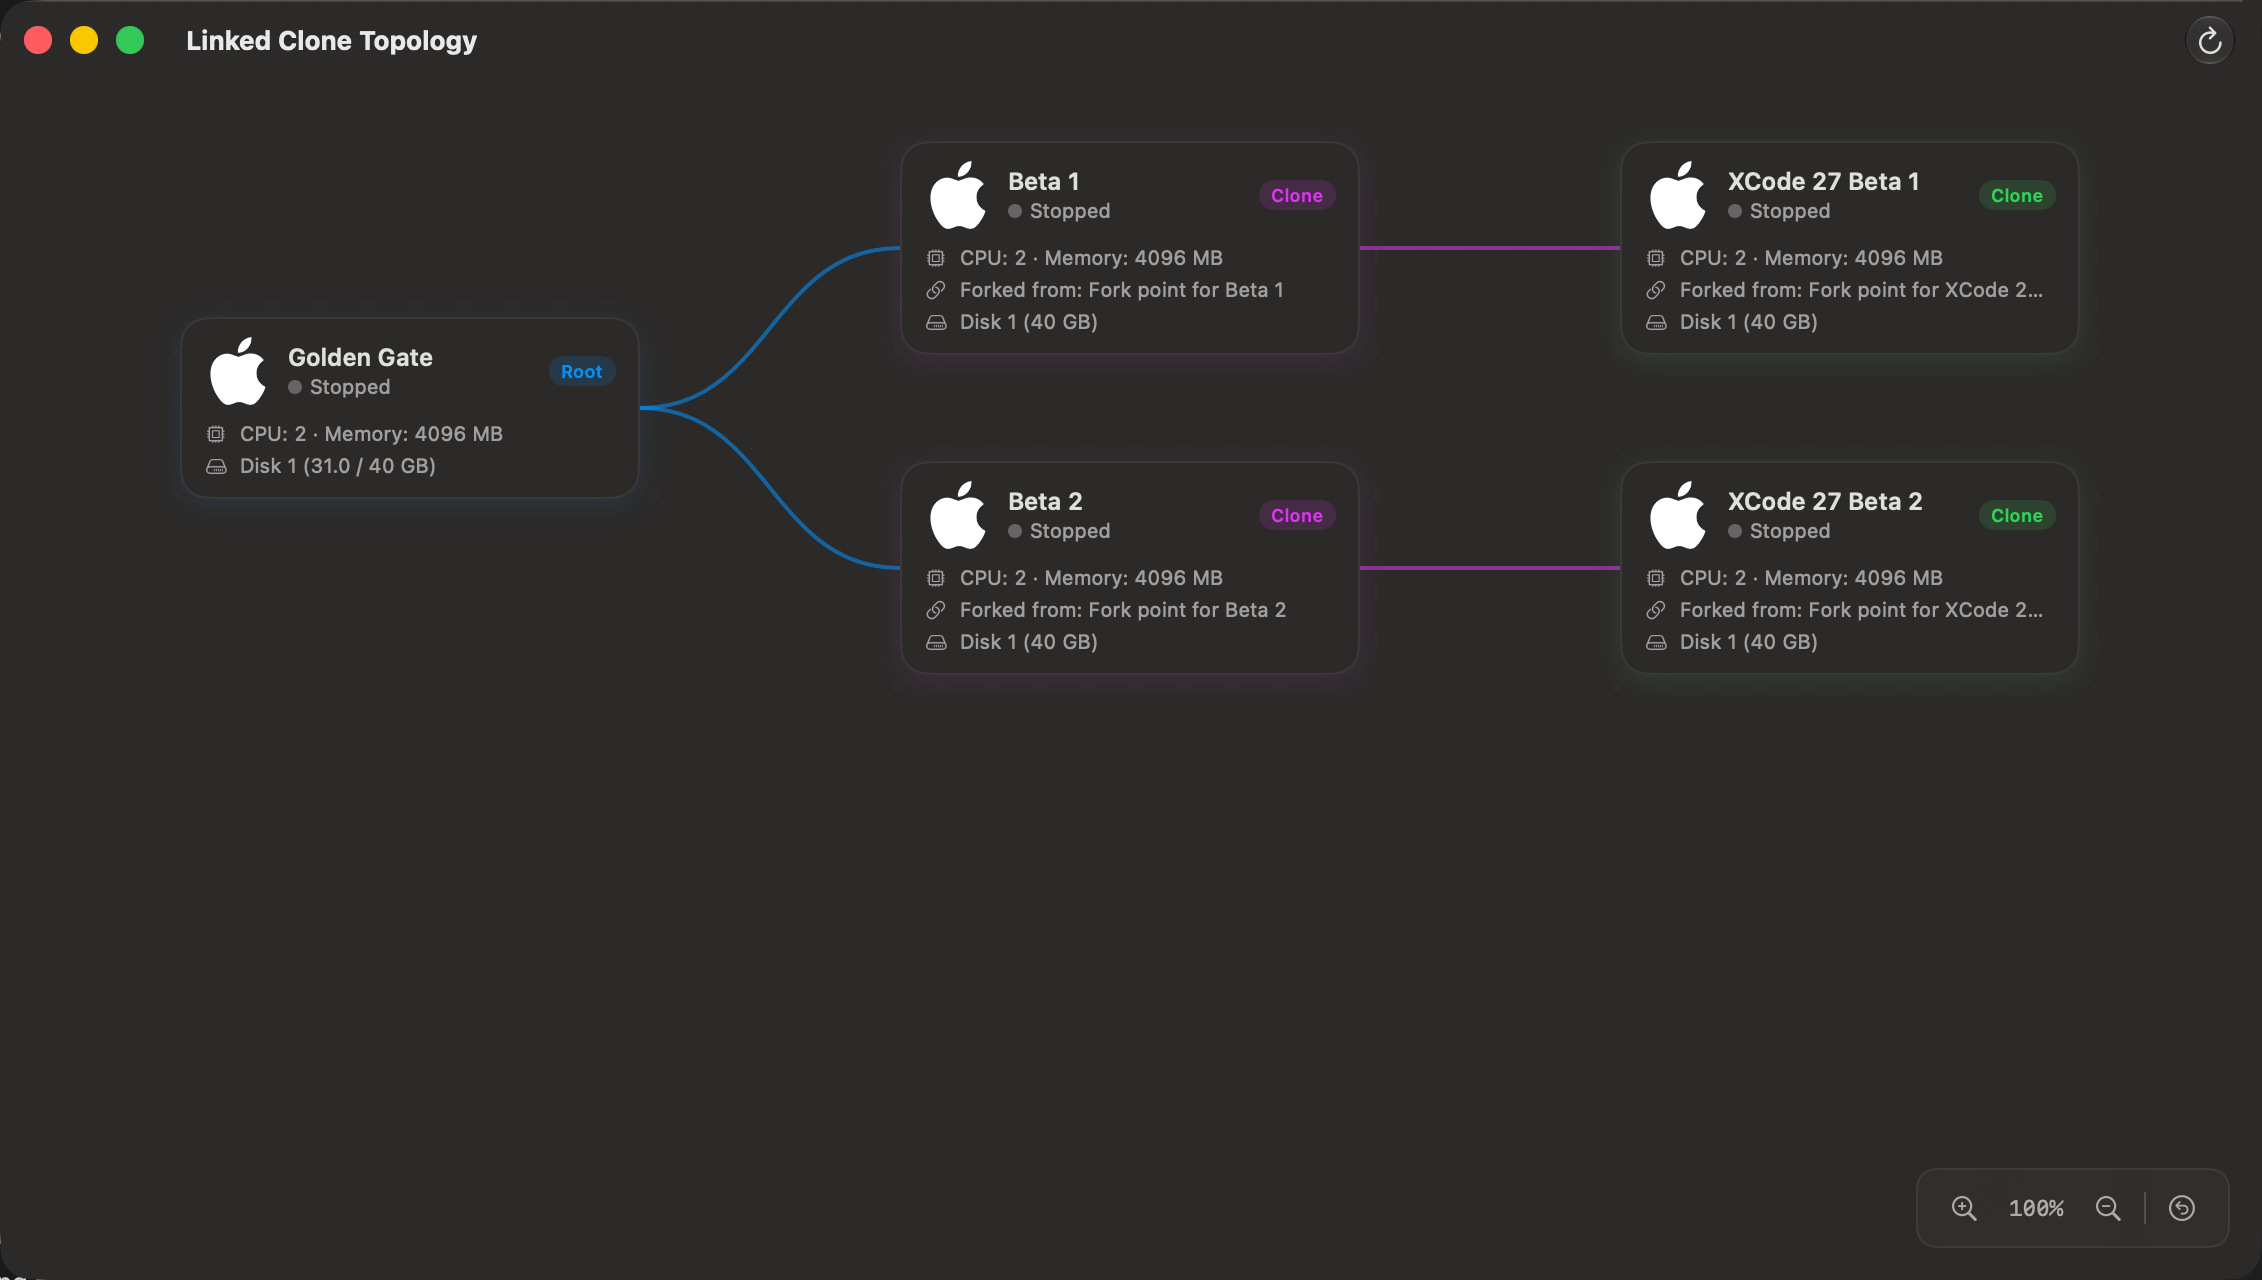
The Linked Clone Topology diagram gives you a live, visual map of every linked clone relationship across your VM fleet. It shows each parent VM, every clone forked from it, and how far each clone is removed from its root — without opening individual VM configurations.
⚠️ Requires macOS 27 Golden Gate or later, since Linked Clones themselves require it.
Open it from Tools → Linked Clone Topology.
Overview
The diagram is laid out left-to-right by generation depth:
| Column | What it shows |
|---|---|
| Column 1 | Root VMs — VMs that are not themselves a linked clone, but have at least one clone forked from them |
| Column 2 | Direct (first-generation) clones of a root |
| Column 3+ | Clones of clones, to any depth — a clone of a clone appears one column further right than its immediate parent |
Solid bezier curves connect each parent to its clones. VMs with no linked clone relationships at all are not shown — this view is scoped to clone lineage only.
If your fleet has more than one independent clone tree (multiple unrelated root VMs with their own clones), each tree is stacked vertically as its own group.
Color Coding
Each generation depth gets its own accent color, cycling through the same 8-color palette used by Network Topology. A root and its first-generation clones are different colors, and a clone-of-a-clone gets yet another color one step further along the palette. This makes it easy to see how many "generations" deep a clone is at a glance, even in a large tree.
The color appears on the clone node's Clone/Root badge, its connection lines, and (when selected) its border and highlight glow.
Clone Node
Each VM card in the diagram shows:
- VM icon — custom icon (if set) or the default macOS/Linux icon
- VM name
- Clone / Root badge — colour-coded by generation depth (see above)
- Running state — a green
Runningdot and label when the VM is active, greyStoppedotherwise - CPU & Memory — the VM's configured vCPU count and memory size
- Forked from — the checkpoint this clone was forked from, shown only on clone nodes (not on roots)
- Disks — each disk's name and size, e.g.
Disk 1 (20 GB); Disk 2 (0.0 / 5 GB)
If the Forked from or Disks text is too long to fit on the card, it's truncated with … — hover over it to see the full text in a tooltip.
Selecting Nodes
Click any clone node to highlight it and dim everything unrelated. Clicking the same node again, or clicking anywhere on the empty canvas background, clears the selection and restores all nodes to full opacity.
Zoom & Navigation
The canvas supports both pinch-to-zoom and the zoom controls in the bottom-right corner.
| Control | Action |
|---|---|
| Pinch gesture | Zoom in or out |
| + button | Zoom in by 20% |
| - button | Zoom out by 20% |
| ↺ button | Reset zoom to 100% |
| Scroll | Pan horizontally and vertically |
The zoom level percentage is displayed between the zoom buttons.
Toolbar
| Button | Action |
|---|---|
| ↻ Refresh | Rebuild the diagram from the latest VM and linked clone configuration |
Web Dashboard
The same diagram is available in the Web Dashboard's Checkpoints tab as a Topology view toggle, alongside the regular checkpoint list and grid views. It's only shown to the master token or a scoped token with admin access to all VMs, since the diagram can include VMs outside a restricted token's allowed set.
Tips
- No clones yet? — the diagram shows an empty state until you create your first linked clone. VMs that aren't part of any clone relationship never appear here.
- Spotting deep chains — the color progression across columns makes it easy to spot how deeply nested a clone is without counting columns manually.
- Renames are safe — clones and parents are tracked internally by identity, not by name, so renaming a VM doesn't break its place in the diagram.