📋 Logs
The Logs tab is available in the dashboard when Logs is enabled in Settings → Advanced → Logs. If the setting is off, the tab is not shown.
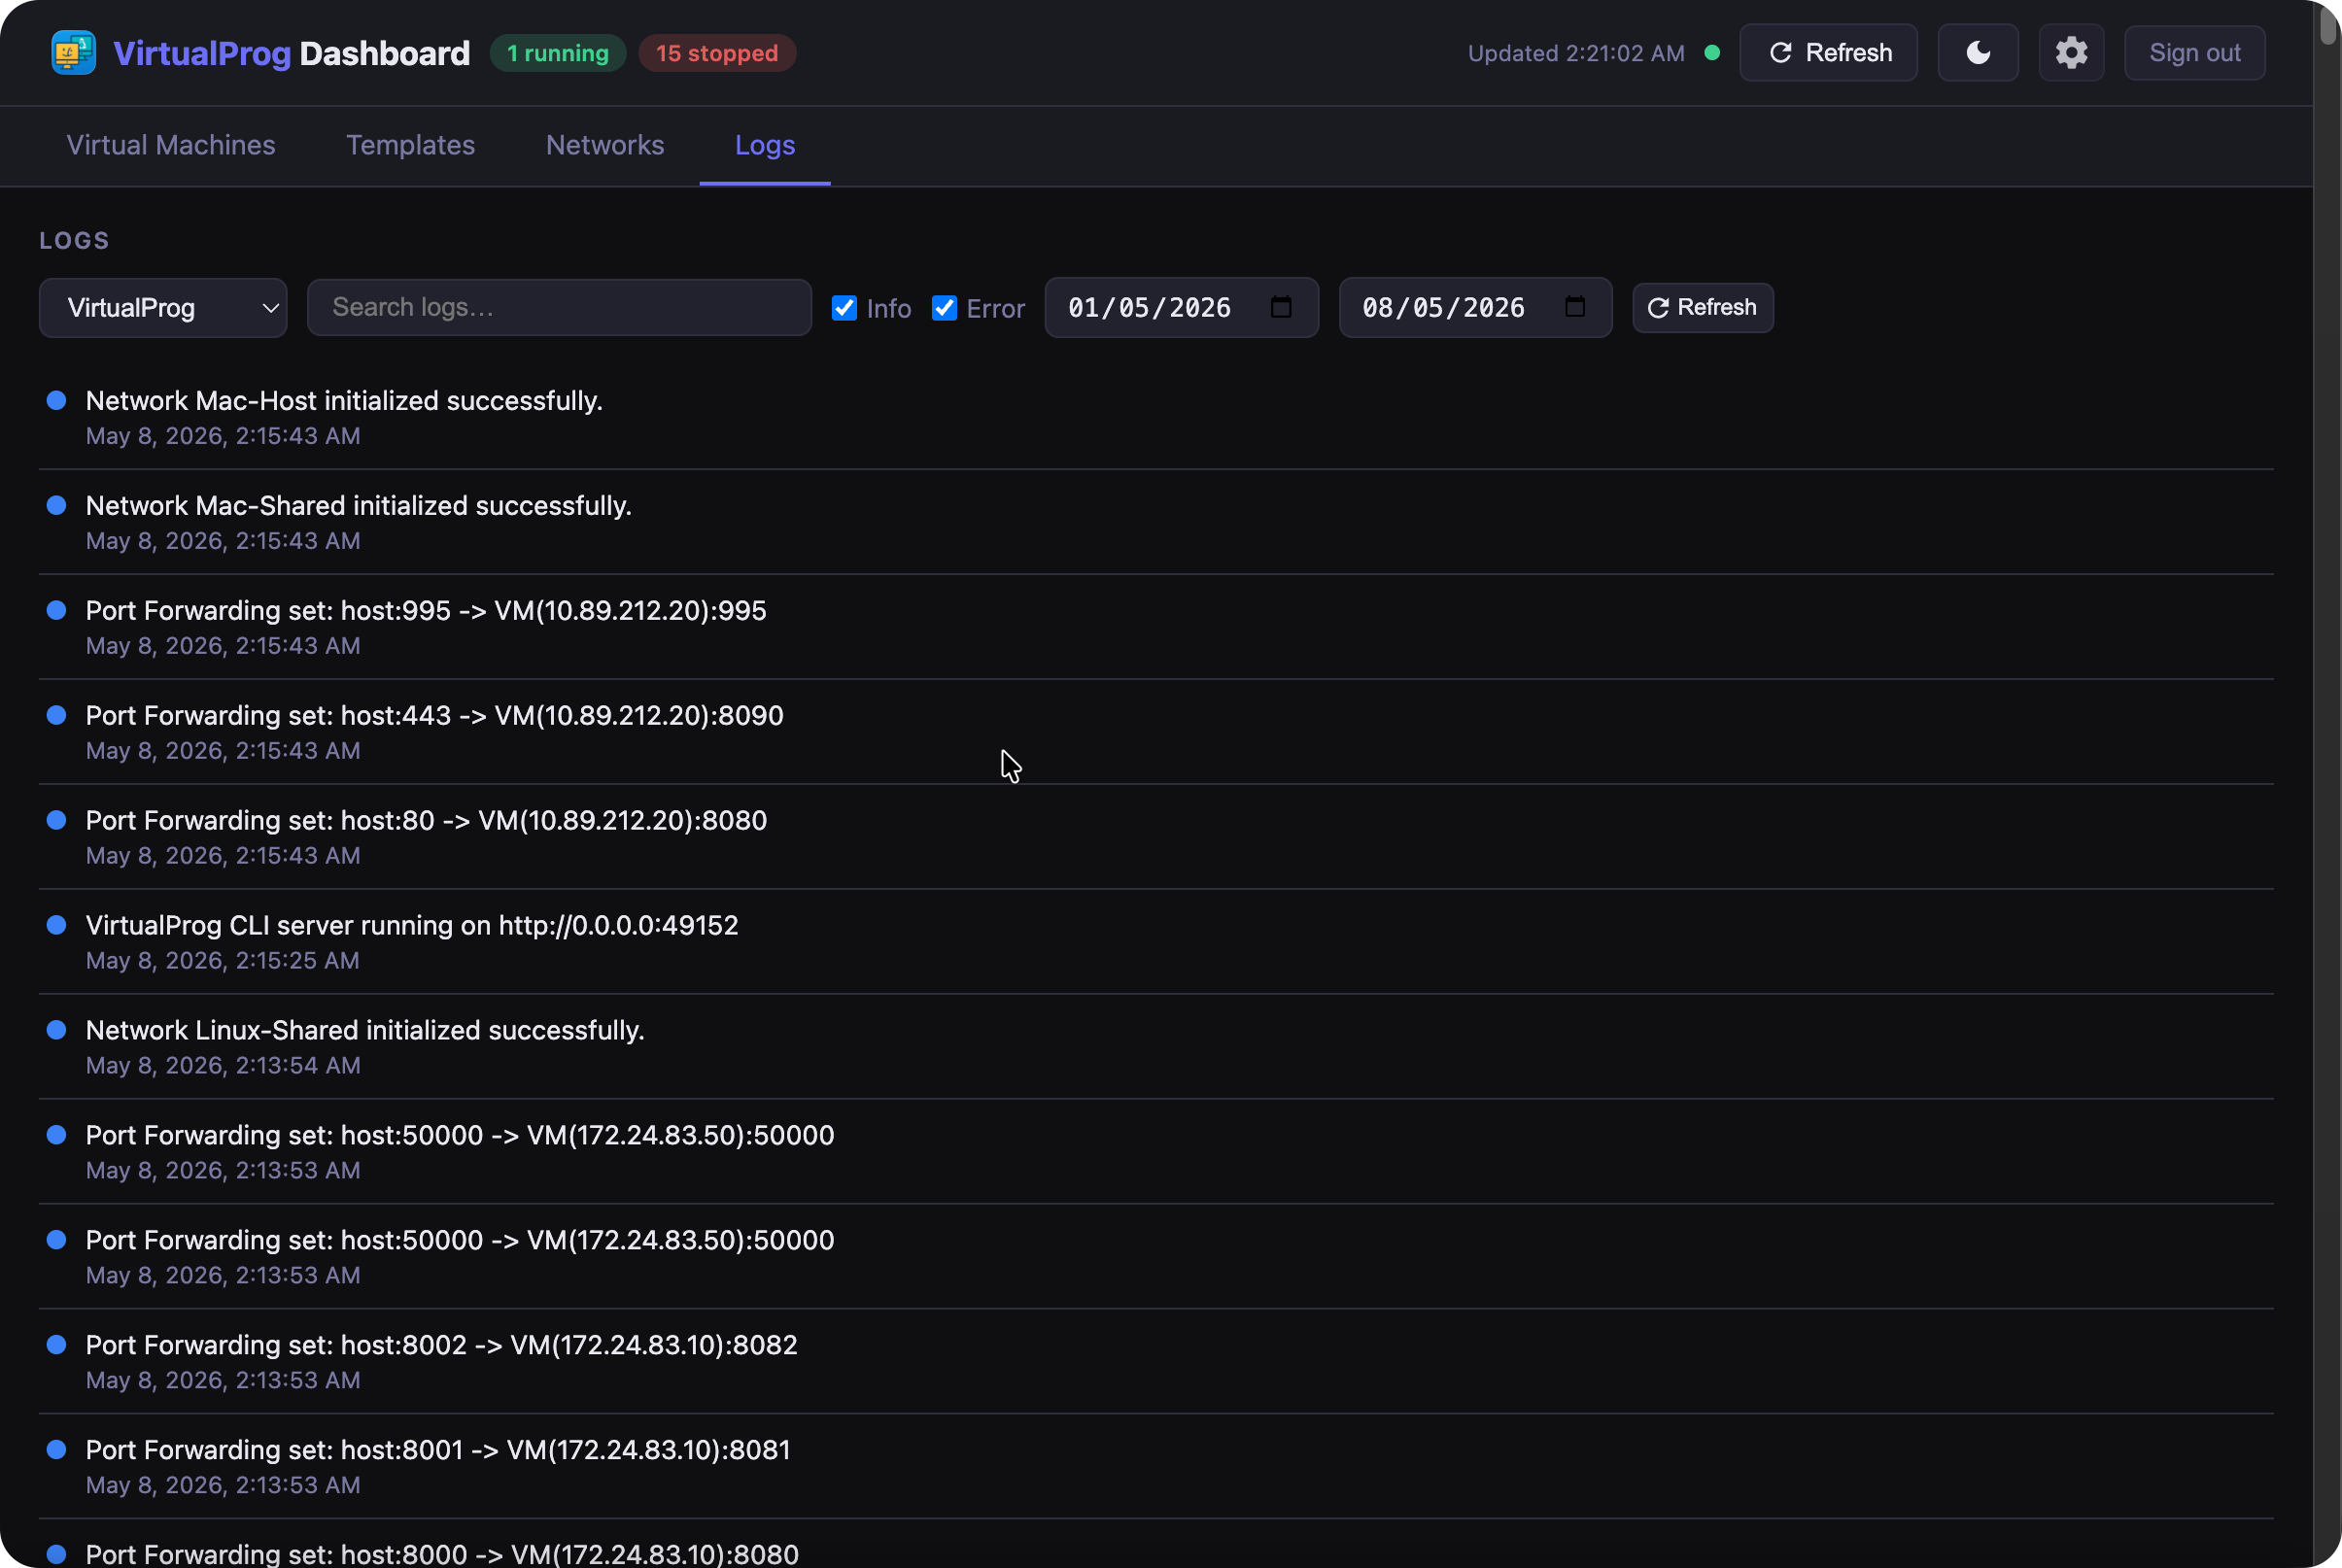
The tab provides a unified view of all log entries written by VirtualProg — both application-level events and per-VM activity — in one place.
Selecting a Source
Use the source dropdown at the top of the toolbar to choose which logs to display:
- VirtualProg — general application events (server start/stop, settings changes, network activity, and other system-level messages)
- VM name — events specific to that virtual machine (start, stop, pause, resume, errors, and other VM-level activity)
Switching the dropdown immediately fetches and displays the selected source's log entries.
Filtering Logs
| Filter | Description |
|---|---|
| Search | Type any text to filter entries by message content — results update as you type |
| Info / Error | Toggle checkboxes to show or hide entries of each severity |
| From / To | Date range pickers — only entries within the selected window are shown. Defaults to the last 7 days |
All filters work together on the already-fetched data — no extra network request is needed when changing filters.
Log Entries
Each entry shows:
- A coloured dot indicating severity — blue for info, red for error
- The log message
- The timestamp — formatted as date and time (e.g. Apr 19, 2025 at 2:34:56 PM)
Entries are displayed newest first.
Refreshing
Click ↺ Refresh to re-fetch the latest entries for the currently selected source.
Following Logs Live
Click the ▶ Follow button in the toolbar to stream new log entries in real time. While active, a pulsing green dot appears on the button and each new entry appended by VirtualProg is added to the list immediately — no need to refresh manually.
Click the button again (now showing ⏸ Pause) to stop following.
If your API token is scoped to specific VMs, attempting to follow a VM outside that scope shows an inline error banner explaining which VMs the token allows. Dismiss the banner with ✕ or switch to an allowed VM to try again.
Logs are only written when Settings → Advanced → Logs is enabled. If log entries are missing, verify the setting is on.