📊 Statistics
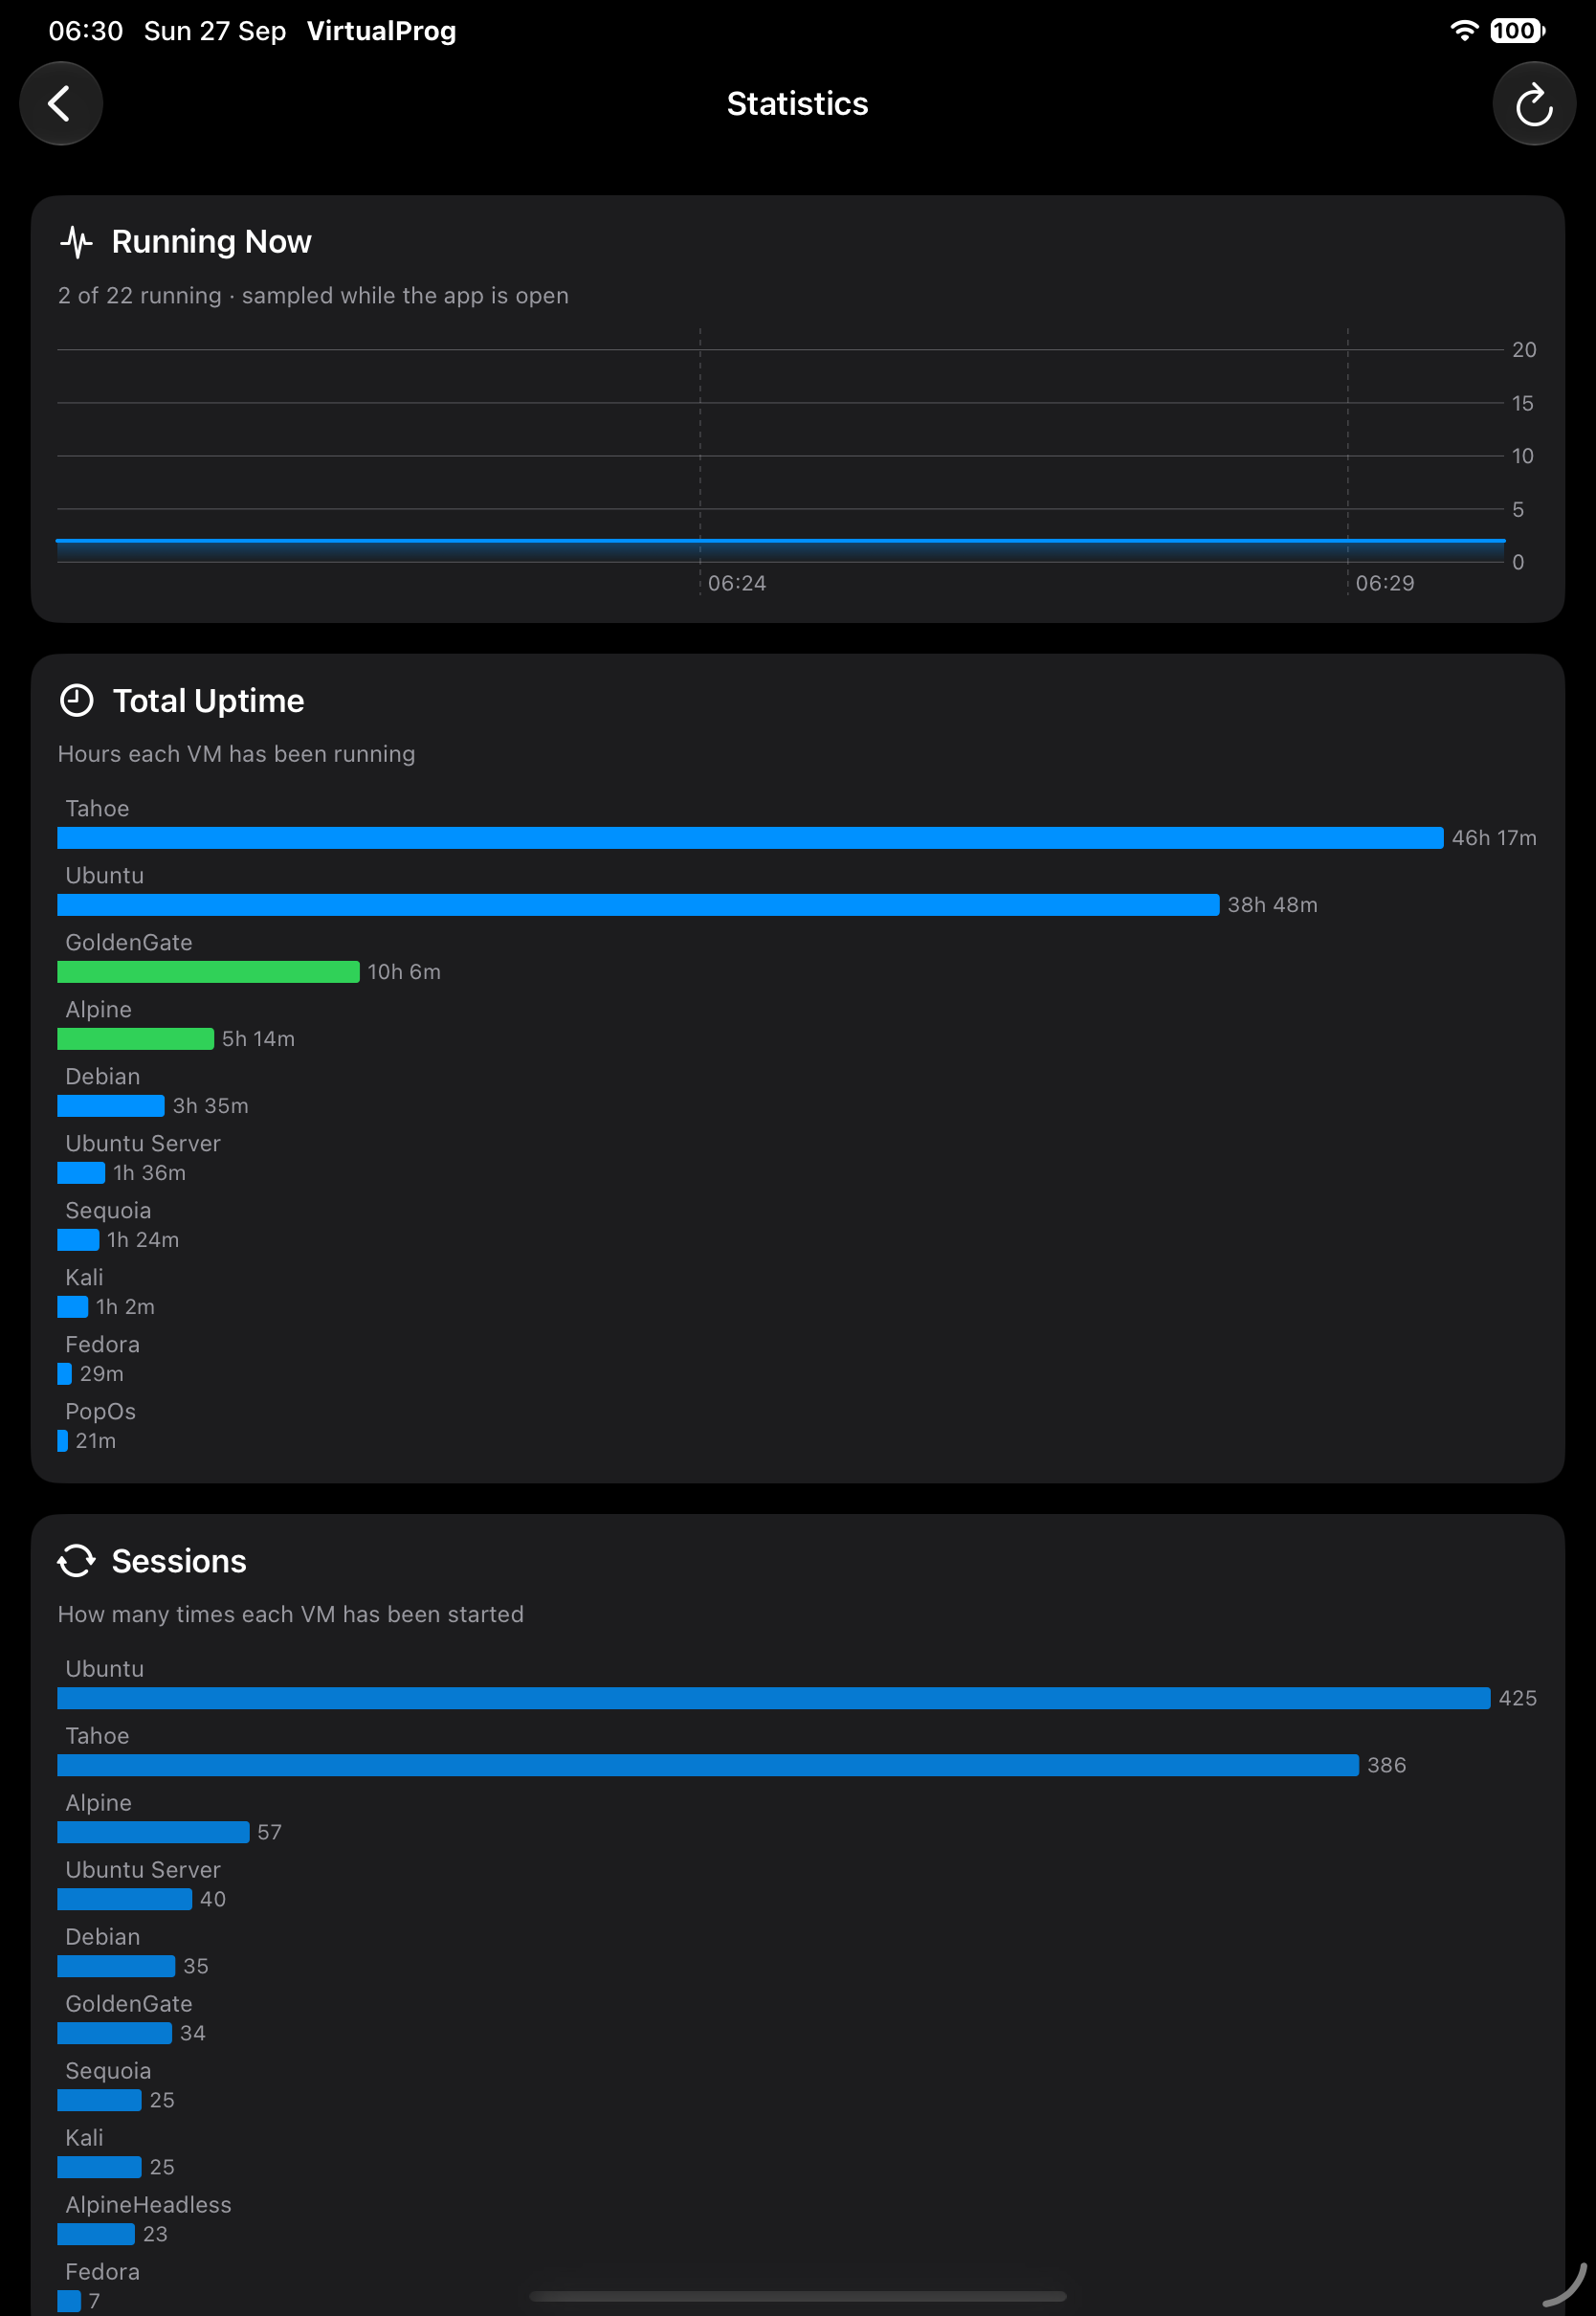
Statistics charts how much your VMs have been used. Open More → Tools → Statistics (iPad: Tools → Statistics).
| Chart | Description |
|---|---|
| Running Now | How many VMs are running over time. It builds up while the app is open and starts fresh each time you launch it |
| Total Uptime | Hours each VM has run — the top ten. Running VMs are shown in green |
| Sessions | How many times each VM has been started — the top ten |
| Recently Started | The six most recent starts; tap one to open the VM |
Pull down or tap Refresh to reload. A VM's own totals — uptime, sessions, average session and last started — also appear under Usage in its details. On iPad (Android has no separate windows), tap the window button in the toolbar to open Statistics in its own window.
Note: These figures come from the uptime and session counts VirtualProg records. Live CPU and memory usage are not recorded.